You ship a small CSS change. Nothing dramatic. A week later someone mentions the homepage feels sluggish, and now you're digging through six commits trying to figure out which one added 400ms to your load time. This is the exact problem Lighthouse CI was built to solve.
Instead of finding out about performance regressions from a frustrated user or a dropping conversion rate, you catch them the moment they're introduced, right in your deployment pipeline.
What Lighthouse CI Actually Does
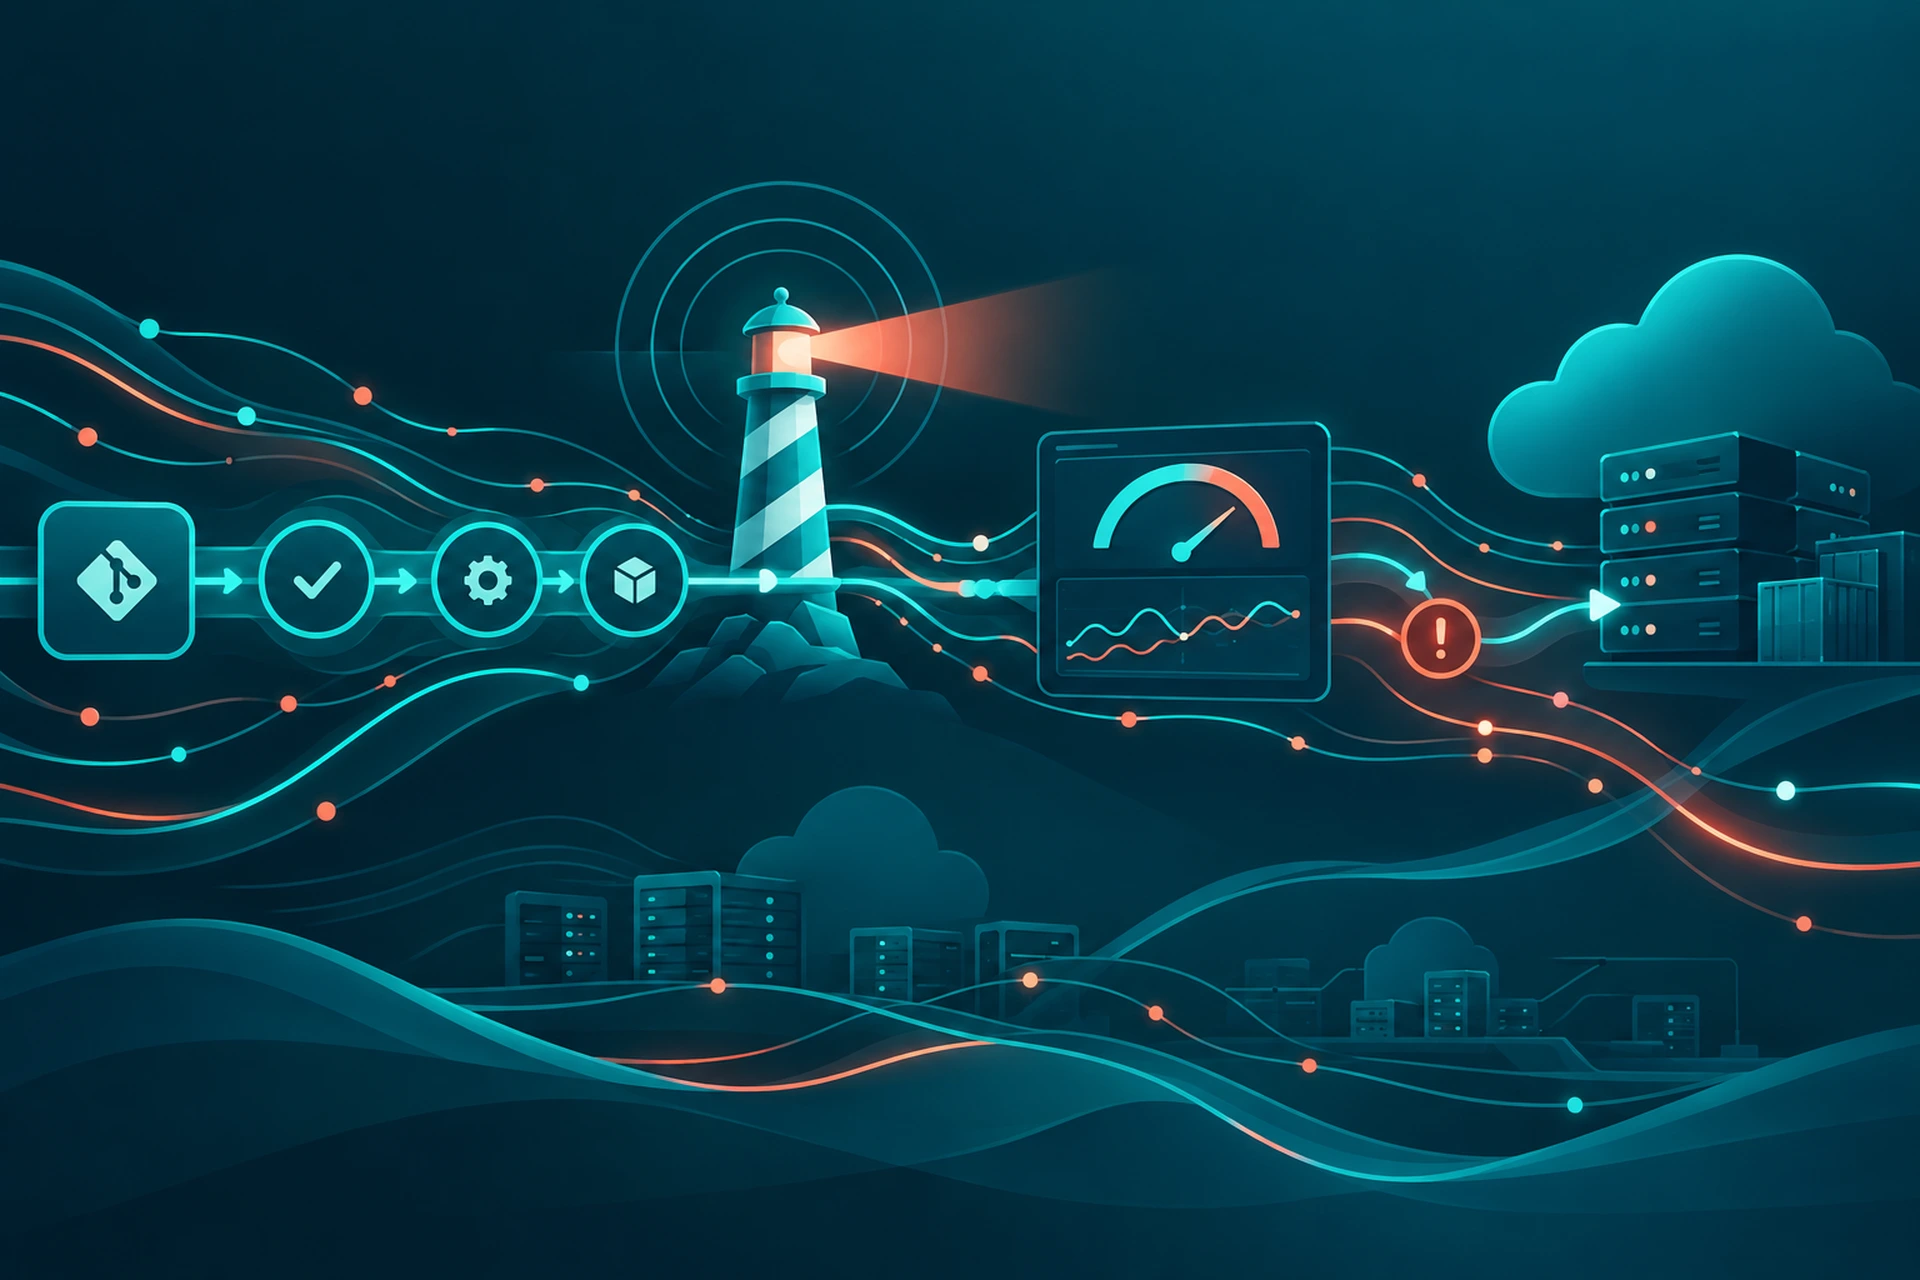
Lighthouse CI is the automated, scriptable version of the Lighthouse audits you've probably run manually in Chrome DevTools. Instead of clicking a button and reading a report once, it runs those same audits automatically on every pull request or deployment, then compares the results against a baseline.
It measures the metrics that matter most for real user experience:
- Largest Contentful Paint (LCP) - how long until the main content is visible
- Total Blocking Time (TBT) - how much the main thread is tied up during load
- Cumulative Layout Shift (CLS) - how much the page jumps around while loading
- Speed Index and Time to Interactive
These are the same metrics behind Core Web Vitals, which means Lighthouse CI gives you a direct line of sight into how your Google rankings and user experience scores might shift before you ever hit production.
Where It Fits in Your Pipeline
The real value of Lighthouse CI comes from where you place it. Running it manually once a month tells you almost nothing useful. Running it automatically on every build tells you exactly which commit caused a problem.
On Every Pull Request
This is the most effective spot. When a developer opens a PR, Lighthouse CI spins up a build, runs audits against it, and comments the results directly on the PR. If LCP jumps from 1.8s to 3.2s because someone added an unoptimized hero image, you see it before merging, not after.
On Staging Before Production
A second checkpoint on your staging environment catches issues that only show up with production-like data or server configuration. This is also a good place to test under conditions closer to real traffic, since staging environments let you validate changes without touching your live site.
Post-Deployment as a Safety Net
Even with checks earlier in the pipeline, it's smart to run Lighthouse CI against production periodically after deploys. Real-world factors like CDN cache warm-up or third-party script changes can shift scores in ways staging doesn't always reveal.
Setting Performance Budgets That Actually Block Bad Deploys
Lighthouse CI becomes genuinely useful once you set performance budgets, specific thresholds that fail the build if crossed. Without budgets, you're just generating reports nobody reads.
A basic budget configuration looks like this:
{ "ci": { "assert": { "assertions": { "largest-contentful-paint": ["error", {"maxNumericValue": 2500}], "total-blocking-time": ["error", {"maxNumericValue": 300}], "cumulative-layout-shift": ["error", {"maxNumericValue": 0.1}] } } } }With this in place, a pull request that pushes LCP past 2.5 seconds literally cannot merge until someone fixes it. That's the difference between performance being a suggestion and performance being a requirement.
Common Pitfalls That Make Lighthouse CI Noisy
Teams often abandon Lighthouse CI within a month because the results feel inconsistent. A few fixes handle most of this:
- Run multiple trials per audit. A single run can vary by 15-20% due to normal system jitter. Averaging 3-5 runs smooths this out.
- Use consistent hardware throttling. Lighthouse simulates a mid-tier mobile device by default. Keep this consistent across runs so you're comparing apples to apples.
- Separate first-load and cached-load tests. A page that looks fast on repeat visits might be hiding a slow first paint.
- Don't test against a cold server. If your test environment has to spin up from zero, your Time to First Byte numbers will be misleading. This is one of several reasons server response time matters so much, something we've covered in Why Your Time to First Byte Is Costing You Conversions.
Why This Matters Beyond the Dashboard
Performance regressions are rarely dramatic. They're usually a 200ms creep here, a 50KB image there, an extra tracking script added without a second thought. None of these feel urgent in isolation. Over six months, they add up to a site that's noticeably slower than it used to be, with no single commit to blame.
Lighthouse CI turns that slow creep into something visible and attributable. Every regression gets tied to a specific change, which makes it someone's responsibility to fix before it ships, not something to triage later when traffic has already dropped.
This pairs well with ongoing synthetic checks after deployment too. We've written more about that approach in How Synthetic Monitoring Catches Performance Regressions Before They Hit Production, which covers the production-side half of this equation.
Getting Started Without Overhauling Your Pipeline
You don't need a full CI/CD rebuild to start using Lighthouse CI. Most teams begin with a lightweight setup:
- Add the @lhci/cli package to your repo
- Configure a GitHub Action or GitLab CI job to run it on pull requests
- Start with warnings instead of hard failures for the first few weeks
- Once your baseline stabilizes, convert key metrics to blocking assertions
If your underlying hosting environment has inconsistent response times, Lighthouse CI results will bounce around no matter how carefully you configure it. That's less a tooling problem and more an infrastructure one. For a deeper look at the server-side factors that shape your baseline, see What Fast Web Hosting Actually Looks Like Under the Hood.
The Takeaway
Website performance monitoring shouldn't start after launch, it should start in your pull requests. Lighthouse CI gives you a repeatable, automated way to measure the metrics that actually affect your users and your search rankings, and it catches regressions while they're still a one-line diff instead of a mystery three weeks later. Set a budget, wire it into your pipeline, and let it do the boring work of watching every single deploy so you don't have to.